Page 57 - FY 2024-25 Budget Book - Full Version
P. 57

Finance and Administration


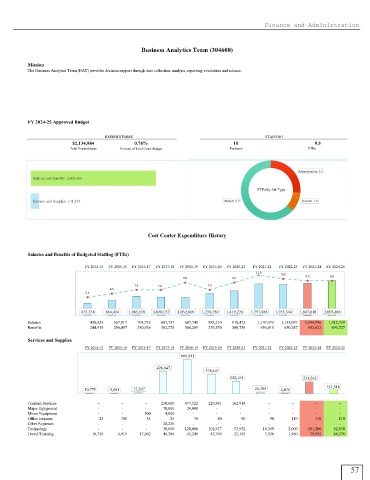
                                                Business Analytics Team (304600)

          Mission
          The Business Analytics Team (BAT) provides decision support through data collection, analysis, reporting, evaluation and science.


          FY 2024-25 Approved Budget

                                    EXPENDITURES                                         STAFFING
                         $2,134,984           0.76%                           10                                9.5
                        Total Expenditures  Percent of Total Court Budget    Positions                 FTEs


                                                                                                    Administration 2.5
            Salaries and Benefits 2,003,466
                                                                                      FTEs by Job Type

            Services and Supplies 131,518                                  Analyst 6.0               Director 1.0


                                                  Cost Center Expenditure History


          Salaries and Benefits of Budgeted Staffing (FTEs)
                             FY 2014-15  FY 2015-16  FY 2016-17  FY 2017-18  FY 2018-19  FY 2019-20  FY 2020-21  FY 2021-22  FY 2022-23  FY 2023-24  FY 2024-25
                     2,500,000                                                        11.0                           1
                                                                                              10.0
                                                              9.0             9.0                     9.5     9.5
                     2,000,000                                                                                       1
                                             7.0     7.0              7.0                                            8
                     1,500,000       6.0
                             5.0                                                                                     6
                     1,000,000
                                                                                                                     4
                      500,000                                                                                        2
                            675,338   864,414   1,085,658   1,050,032   1,032,018   1,258,780   1,419,228   1,797,888   1,763,344   1,847,618   2,003,466
                         -                                                                                           -
          Salaries                 430,423        567,917        704,732        687,757        687,749        882,210        918,472          1,147,473     1,133,097     1,194,996     1,312,739
          Benefits                 244,915        296,497        380,926        362,275        344,269        376,570        500,756   650,415        630,247        652,622        690,727
          Services and Supplies
                             FY 2014-15  FY 2015-16  FY 2016-17  FY 2017-18  FY 2018-19  FY 2019-20  FY 2020-21  FY 2021-22  FY 2022-23  FY 2023-24  FY 2024-25
                       800,000
                                                             666,841
                       700,000
                       600,000
                       500,000                       428,647         378,647
                       400,000
                                                                             242,151
                       300,000                                                                       231,262
                       200,000
                       100,000  10,775   5,691   17,597                              26,385   4,070          131,518
                          -
          Contract Services       -       -       -        250,000        477,522        229,881        162,914   -   -   -   -
          Major Equipment         -       -       -          70,000          24,000   -   -   -    -      -       -
          Minor Equipment         -       -       500            4,000   -   -   -         -       -      -       -
          Office Expense           25     780     35      25      70      80      90       90     110     110     110
          Other Expenses          -       -       -          28,236   -   -      -         -       -      -       -
          Technology              -       -       -          30,000        120,000        102,917          53,952   18,369            2,000        191,200          62,830
          Travel/Training            10,750            4,911          17,062          46,386          45,249          45,769          25,195   7,926            1,960          39,952          68,578


                                                                                                                     57
   52   53   54   55   56   57   58   59   60   61   62