Page 92 - FY 2023-24 Budget Book
P. 92

Operations


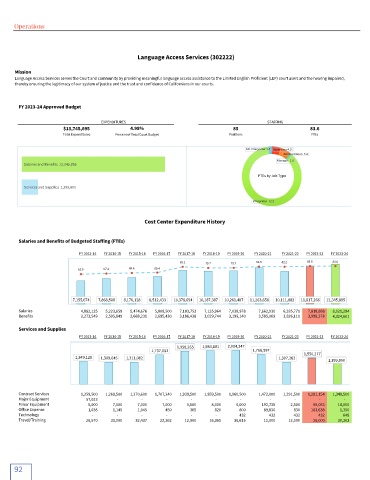
                                               Language Access Services (302222)

      Mission
      Language Access Services serves the Court and community by providing meaningful language access assistance to the Limited English Proficient (LEP) court users and the hearing impaired,
      thereby ensuring the legitimacy of our system of justice and the trust and confidence of Californians in our courts.


       FY 2023-24 Approved Budget


                                   EXPENDITURES                                          STAFFING
                      $13,745,695           4.98%                             85                           83.6
                      Total Expenditures  Percent of Total Court Budget      Positions                  FTEs

                                                                                  ASL Interpreter 1.5  Supervisor 4.0

                                                                                               Administration 5.0
                                                                                             Manager  1.0
         Salaries and Benefits 12,345,895
                                                                                      FTEs by Job Type
         Services and Supplies 1,399,800

                                                                                     Interpreter 72.1


                                                 Cost Center Expenditure History


       Salaries and Benefits of Budgeted Staffing (FTEs)

                           FY 2013-14  FY 2014-15  FY 2015-16  FY 2016-17  FY 2017-18  FY 2018-19  FY 2019-20  FY 2020-21  FY 2021-22  FY 2022-23  FY 2023-24
                  14,000,000                                                                                          100
                                                             82.1    79.7    79.7     82.6    82.2     83.6    83.6
                  12,000,000
                           65.9    67.4     68.6    69.4                                                              80.00
                  10,000,000
                   8,000,000                                                                                          60.00
                   6,000,000                                                                                          40.00
                   4,000,000
                                                                                                                      20.00
                   2,000,000
                         7,155,674   7,868,508   8,176,128   8,512,433   10,378,694   10,187,387   10,261,487   11,263,658   10,111,882   11,817,266   12,345,895
                       -                                                                                              -
       Salaries                 4,882,125       5,223,659       5,474,676       5,808,500       7,183,753       7,135,964       7,038,978             7,662,930       6,285,771       7,818,888       8,021,294
       Benefits                 2,273,549       2,595,849       2,688,231       2,695,430       3,186,438       3,029,744       3,199,140             3,585,069       3,826,111       3,998,378       4,324,601
       Services and Supplies
                           FY 2013-14  FY 2014-15  FY 2015-16  FY 2016-17  FY 2017-18  FY 2018-19  FY 2019-20  FY 2020-21  FY 2021-22  FY 2022-23  FY 2023-24
                    2,500,000
                                                            1,958,265   1,984,681   2,004,347
                    2,000,000                      1,737,052                         1,766,997        1,550,277
                          1,349,128   1,309,645   1,311,082                                  1,307,262
                    1,500,000                                                                                 1,399,800
                    1,000,000
                     500,000
                        -
       Contract Services        1,259,500       1,268,500       1,270,600       1,707,240       1,939,500       1,959,500       1,960,500             1,472,000       1,291,500       1,281,154       1,349,500
       Major Equipment                57,023    -  -      -     -         -     -           -     -          -     -
       Minor Equipment                  5,000               7,000               7,000               7,000               5,500               8,000               6,000   192,735               2,500             59,053             18,000
       Office Expense                   1,035               1,145               1,045   450   365   820   800    89,830   830           183,638               1,350
       Technology                 -     -         -     -         -     -        432        432    432     432     648
       Travel/Training                26,570             33,000             32,437             22,362             12,900             16,361             36,615    12,000             12,000             26,000             30,303


      92
   87   88   89   90   91   92   93   94   95   96   97