Page 42 - FY 2023-24 Budget Book
P. 42

Court Technology Services


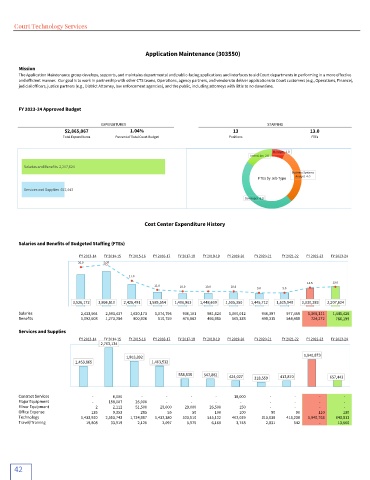
                                                 Application Maintenance (303550)


       Mission
       The Application Maintenance group develops, supports, and maintains departmental and public-facing applications and interfaces to aid Court departments in performing in a more effective
       and efficient manner.  Our goal is to work in partnership with other CTS teams, Operations, agency partners, and vendors to deliver applications to Court customers (e.g., Operations, Finance),
       judicial officers, justice partners (e.g., District Attorney, law enforcement agencies), and the public, including attorneys with little to no downtime.


       FY 2023-24 Approved Budget

                                   EXPENDITURES                                          STAFFING
                      $2,865,067            1.04%                             13                               13.0
                      Total Expenditures  Percent of Total Court Budget      Positions                  FTEs


                                                                                           Manager 1.0
                                                                                    Technician 2.0
         Salaries and Benefits 2,207,624
                                                                                                  Business Systems
                                                                                      FTEs by Job Type  Analyst 4.0

         Services and Supplies 657,443
                                                                                  Developer 6.0


                                                 Cost Center Expenditure History


       Salaries and Benefits of Budgeted Staffing (FTEs)
                           FY 2013-14  FY 2014-15  FY 2015-16  FY 2016-17  FY 2017-18  FY 2018-19  FY 2019-20  FY 2020-21  FY 2021-22  FY 2022-23  FY 2023-24   30.00
                   5,000,000
                           26.0    27.8
                                                                                                                      25.00
                   4,000,000
                                                                                                                      20.00
                                            17.0
                   3,000,000                                                                                          15.00
                                                                                                       12.5    13.0
                                                    11.0
                   2,000,000                                 10.0    10.0    10.0     9.0     9.0                     10.00
                   1,000,000                                                                                          5.00
                         3,526,172   3,866,810   2,426,491   1,585,554   1,406,963   1,448,609   1,505,350   1,445,712   1,525,948   2,030,383   2,207,624
                       -                                                                                              -
       Salaries                 2,433,564       2,593,437       1,620,173       1,074,795           936,101           981,624       1,000,012   946,397           977,459       1,306,111       1,441,426
       Benefits                 1,092,608       1,273,284           800,926           510,759           470,862           466,985           505,338   499,315           548,489           724,272           766,199
       Services and Supplies
                           FY 2013-14  FY 2014-15  FY 2015-16  FY 2016-17  FY 2017-18  FY 2018-19  FY 2019-20  FY 2020-21  FY 2021-22  FY 2022-23  FY 2023-24
                    3,000,000     2,763,134
                    2,500,000
                    2,000,000              1,803,892                                                  1,940,873
                          1,453,865                1,463,532
                    1,500,000
                    1,000,000
                                                            558,535   547,882
                     500,000                                                 424,027   318,559   413,870      657,443
                        -
       Contract Services          -    6,000      -     -         -     -              18,000    -  -        -     -
       Major Equipment            -    158,007             25,000    -  -    -  -           -     -          -     -
       Minor Equipment             2               2,112             51,500             29,000             29,000             26,500   150    -  -    -  -
       Office Expense           135               9,353   285   55   50   100    100        90      90     110     130
       Technology               1,433,920       2,553,743       1,724,987       1,432,380           523,510           515,122           402,029   315,638           413,238       1,940,763           643,813
       Travel/Training                19,808             33,919               2,120               2,097               5,975               6,160               3,748   2,831   542    -   13,500


      42
   37   38   39   40   41   42   43   44   45   46   47